I had a look at the python 2D plotting library matplotlib. For more information about this library, you might want to have a look at the corresponding Wikipedia article.
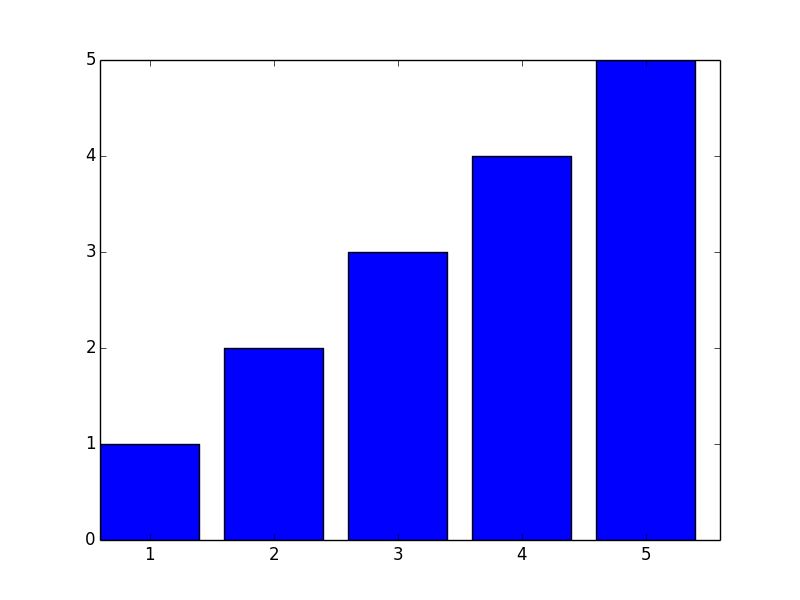
I’m looking for a way to make simple plots from x,y value pairs and it seems that matplotlib is the way to go in Python environments. Let’s have a look at an example. The following script will save a simple bar plot to a PNG file. Nothing fancy, just something to have a starting point.
import matplotlib.pyplot as plt
import numpy as np

data = (1, 2, 3, 4, 5)
pos = np.arange(len(data))
plt.bar(pos, data)
plt.xticks(pos+0.4, data)
plt.savefig("bar.png")
If you have matplotlib correctly installed in your Python environment, it will generate the following bar plot in a PNG file called “bar.png” in the current directory.

Please not that the script generates just the plot, not the subtitle. While you can do this in matplotlib, I have added the subtitle here in HTML for simplicity. I have decided to have a further look at matplotlib. It looks promising and I would like to use it inside a simple web application. Let’s see how far this goes.